HKSFC Licensed Corp #ADC118
October Newsletter

September Newsletter
September 5, 2019
REVIEW OF 2019
November 25, 2019October Newsletter

BACK TEST FROM 2013 ON GLOBAL Stock PORTFOLIO
We have constructed a 20 stock Global Stock portfolio which incorporates our Country and Sector allocation decisions with the largest stocks in those sectors. The rationale for this is that the largest stocks by market capitalization should be highest quality and most robust, leading to their continued growth over time
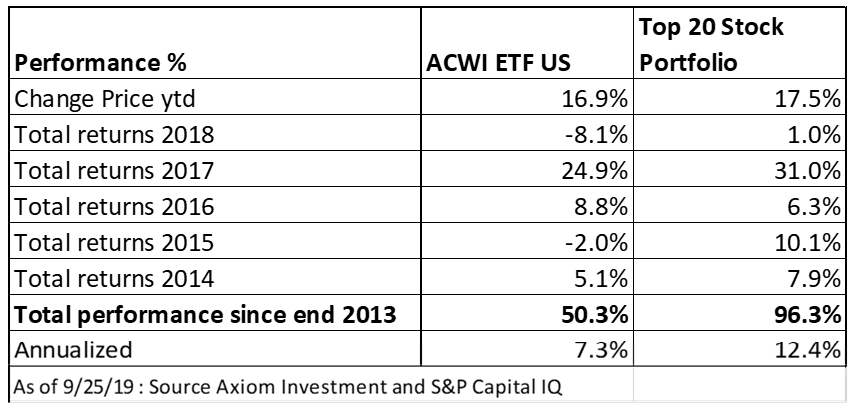
We have carried out a more detailed back test on the top 20 stock portfolio. For ease of calculation we only rebalanced at the end of every calendar year but applied the rules of construction to the stocks as of that time. Referring to the table below the portfolio has outperformed every single year since end 2013, except for 2016 when it underperformed slightly. It performed particularly well in the down years of 2015 and 2018 when it was able to record positive returns. Overall the top 20 stock portfolio produced a 96.3% return since the end of 2013 compared with a 50.3% return for the benchmark, which is the ETF on the MSCI AC world index
Splitting the portfolio into its component parts is illuminating. Staring with China, the portfolio has done very well returning 115% vs 43% for the ETF on MSCI China. The portfolio owned Tencent (up 248%) and China Construction Bank (up 41%). As of end 2013 Alibaba was not listed so the portfolio owned China Mobile in 2014/2015 (up 14%) and AIA in 2016 (down 6%). Although Alibaba was listed in 2014 it only fully entered the MSCI Indices at the end of 2016, which is when we bought it for the portfolio. Since then it gained 105%. Going forward I think that China Construction Bank is likely to perform in line with the benchmark, whereas Alibaba and Tencent, should continue to outperform as they are leaders in the new economy, where growth should continue to outpace other sectors.
Within the Industrial sector, we only own stock. When the back test started as of end 2013 that was General Electric”GE” then the largest Industrial globally, which the portfolio owned until end 2017, at which point GE was sold and Boeing purchased as GE share price had fallen such that Boeing had overtaken it as the largest Industrial stock in the world. As a result, the Industrial part of the portfolio contributes negative 3.5% vs positive 55% for the benchmark.
Within the Energy sector we only own Exxon Mobil, which has been owned throughout the period. It was the largest energy stock globally as of end 2013 and remains so today. It has returned a negative 13.1% return over the period compared to negative 11,7% for its benchmark an ETF on the global energy sector.
The top spots in the Global Consumer staple sector have remained consistent over this period being Proctor and Gamble and Nestle. Holding these two stocks over the period yields returns of 78.6% vs 49.7% for the benchmark being the ishare on the global consumer staple sector. This could be explained by the fact that the top two companies have well established brand names and distribution networks which enables them to launch new products more efficiently than their rivals.
We own three stocks on the Consumer Discretion sector being Amazon (largest globally), Toyota (largest stock in Japan) and Alibaba (one of the three largest stocks in China. Amazon and Toyota have been held continuously since the back test started at the end of 2013. Amazon has been the standout performer for the portfolio returning a total of 343% over the period whereas Toyota has returned 32.8%
Top spots in the Technology and Communications sector have been more fluid with only: Alphabet (+120%), Apple (+208%), Microsoft (+322%) being in the top 6 over the whole period. As of the end of 2013 the remaining stocks were IBM (-6.4%), Oracle (+49.7%), Samsung Electronics (+72.7%). Facebook entered the top 6 Tech stocks as of end 2015 and has remained ever since. Visa entered the top 6 Tech stocks at end 2015, although replaced for one year at the end of 2016 by TSMC, it reentered at the end of 2017 and has remained in the top 6 since then. The remaining top spot has rotated between Samsung Electronics, Intel and Cisco, presently its occupied by Intel. Overall the Top 6 tech stocks have outperformed returning 157% over the period vs a 141% return of the benchmark. The Technology sector has been the best performing over this period. Going forward we continue to like the Tech sector for its growth – we also believe that the leaders in the sector are hard to displace as once they become dominant, they are hard to displace think Microsoft, Apple and Alphabet.
The 20-stock portfolio contains 4 shares in the health care sector. Johnson and Johnson has been a constant feature. The following big pharma companies have been in and out of the portfolio: Pfizer, Roche, Novartis and Merck. UnitedHealth Group is an American for-profit managed health care company. It offers health care products and insurance services. The company entered the portfolio at end 2017 and has remained there ever since. The top stocks health care portfolio has returned 42% over the period compared with 63% for the benchmark. This may be due to the fact that the largest stocks all own drugs that are subject to patent expiry – whilst they are all spending large amounts to discover new drugs the chance of success of the large companies relative to the sector at new discoveries may not be commensurate to their size. Therefore, investing in an ETF on the health care sector in place of the Top stock strategy may be considered.
For Financials the portfolio owned Wells Fargo initially but this was replaced by JP Morgan as of end 2016 (as the Wells Fargo share priced performed poorly following the fake account scandal and it was surpassed by JP Morgan in market cap terms). The financial portfolio has returned 130% way outperforming the 36% return of the benchmark (ETF on global financials). That’s larkety because the US financial sector has way outperformed Europe and Japan, which are plagued by ultra-low interest rates together with weaker domestic economies that the US.
Recent change to the portfolio
Due to relative price movement between Novartis and Roche we have (as of September 18) decided to sell Novartis from the Global stock portfolio and replace it with Roche which now has a larger weight in the MSCI Index.
In conclusion the Global Stock portfolio has outperformed for a variety of reasons being:
- Overweight in US, Technology and Health Care
- Underweight in Europe
- Stock selection in China, Consumer, Financials, Technology
The following has detracted from performance: Stock selection within Industrials and health care.
We believe the top 20 Global stock portfolio should continue to produce strong returns relative to the MSCI AC World Index. That’s because it choses the strongest companies (as measured by weight in the MSCI indices). Over time companies may weaken as their business model is challenged and other more successful companies emerge. In that case the portfolio will adjust to own the more successful company. For example, over the period since end 2013: China Mobile has been replaced by Alibaba, Wells Fargo by JPM and IBM by Visa.
All the information contained in this document is as of date indicated unless otherwise noted.
This document is issued by Axiom Investment Management Limited and has not been reviewed by the SFC. It may not be reproduced, distributed or transmitted to any person without express prior permission. This document and the information contained herein may not be distributed and published in jurisdictions in which such distribution and publication is not permitted.
Nothing contained here constitutes investment advice or should be relied on as such. The value of securities mentioned in the report and the income from it, if any, may fall or rise. Past performance of the securities mentioned in the report is not necessarily indicative of its future performance.
Axiom Investment Management Limited, 25/F, 168 Queen’s Road Central, Hong Kong. Telephone: 852 2537 2030 Facsimile: 852 2868-0091. Web: www.axiom-invest.com